Q3 2025-26 Newsletter to PMS Clients from CEO
Posted On : Tue Dec 02 2025
Dear Valued Investors,
The past 12 months have tested the patience of small-cap investors.
I will address following in this newsletter:
- Why small caps underperformed despite India's strong fundamentals
- Technical evidence that the consolidation cycle is ending
- Why we remain confident in our portfolio positioning
- The catalysts that will drive small-cap outperformance ahead
The key message: This is a period of patient accumulation, not panic. The fundamentals driving our investment thesis remain intact, and multiple indicators suggest we are in the final phase of consolidation.
Market Cap Classification: Understanding the Landscape
Indian equity markets are segmented by market capitalization as per SEBI:
| Category | Rank Range | Market Cap Threshold |
|---|---|---|
| Large Cap | 1st - 100th | ≥ ₹91,500 crore |
| Mid Cap | 101st - 250th | ₹30,700 - ₹91,500 crore |
| Small Cap | 251st onwards | < ₹30,700 crore |
Key Insight: The largest small-cap stocks (like Motherson Wiring at ~₹30,550 crore LIC Housing at ~₹30,450 crore) have market caps around ₹25,000-30,000 crore — below the mid-cap threshold. This classification provides Waya PMS's portfolio companies substantial runway for graduation into higher market cap segments as they scale.
Why Broader Markets Underperformed: A Four-Factor Analysis
1. FII Exodus Driven by Attractive US Rates
Foreign Institutional Investors (FIIs) are the primary marginal price setters in Indian equities. Their unprecedented selling triggered the correction:
FII Selling Magnitude:
- October 2024: Record outflow of ₹1,14,446 crore (highest monthly selling ever)
- January 2025: Sold ₹78,000 crore
- 2025 YTD (through November): Net outflow of ₹2,56,201 crore
The Root Cause: US Federal Reserve maintained rates at 4.0-4.25%, with 10-year Treasury yields around 4.4% — providing attractive risk-free returns that competed directly with emerging market equities. We have realized that higher U.S. yields pull capital away from emerging markets like India.
FII selling was particularly brutal for small and mid-caps, which fell 19-25% and 16-20% respectively from their peaks — sharper than the Nifty's 11-14% correction.
2. Global Capital Rush to US AI Stocks
The artificial intelligence investment boom redirected massive global capital flows toward US technology stocks:
- AI startups captured a record 46.4% of total US venture capital in 2024
- Big Tech (Meta, Alphabet, Microsoft, Amazon) projected to spend $405+ billion on AI capex in 2025 — representing 62% YoY growth
- The "Magnificent 7" stocks alone accounted for over half of S&P 500's gains in 2024
This AI euphoria created an irresistible gravitational pull on global liquidity, diverting funds that would have otherwise flowed to emerging markets including India.
3. Record IPO Supply Absorbing Liquidity
India's primary market experienced an unprecedented boom, creating significant secondary market headwinds:
IPO Market Statistics (2025):
- Total Capital Raised: Over ₹1.6 lakh crore (record-breaking)
- FPI Investment in IPOs: $1.3 billion in November 2025 alone
- Impact: Capital diverted from secondary markets to primary markets
4. DII Support Concentrated in Large Caps
While Domestic Institutional Investors (DIIs) provided crucial support with net inflows of ₹6,48,158 crore in 2025, their buying was predominantly concentrated in large-cap and established mid-cap names.
DII Investment Pattern:
- Insurance companies (LIC), pension funds (EPFO), and mutual funds favor liquid large caps
- Regulatory requirements often limit small-cap exposure
- Small caps typically see DII accumulation only after valuation corrections
This created a bifurcated market: large caps supported by DIIs remained resilient, while small caps — dependent on FII flows and retail participation — corrected sharply.
Technical Evidence: Signs of Cycle Bottoming
Multiple Indicators Point to Consolidation End
We believe India is in the "final phase of consolidation". Here's the evidence:
1. Base Formation
The Nifty Smallcap 250 has been forming base since June 2025, a classic technical signal of accumulation and trend reversal preparation. The index bounced 26% from its lows of ₹13,314 and is now consolidating in the ₹16,400-17,500 range.
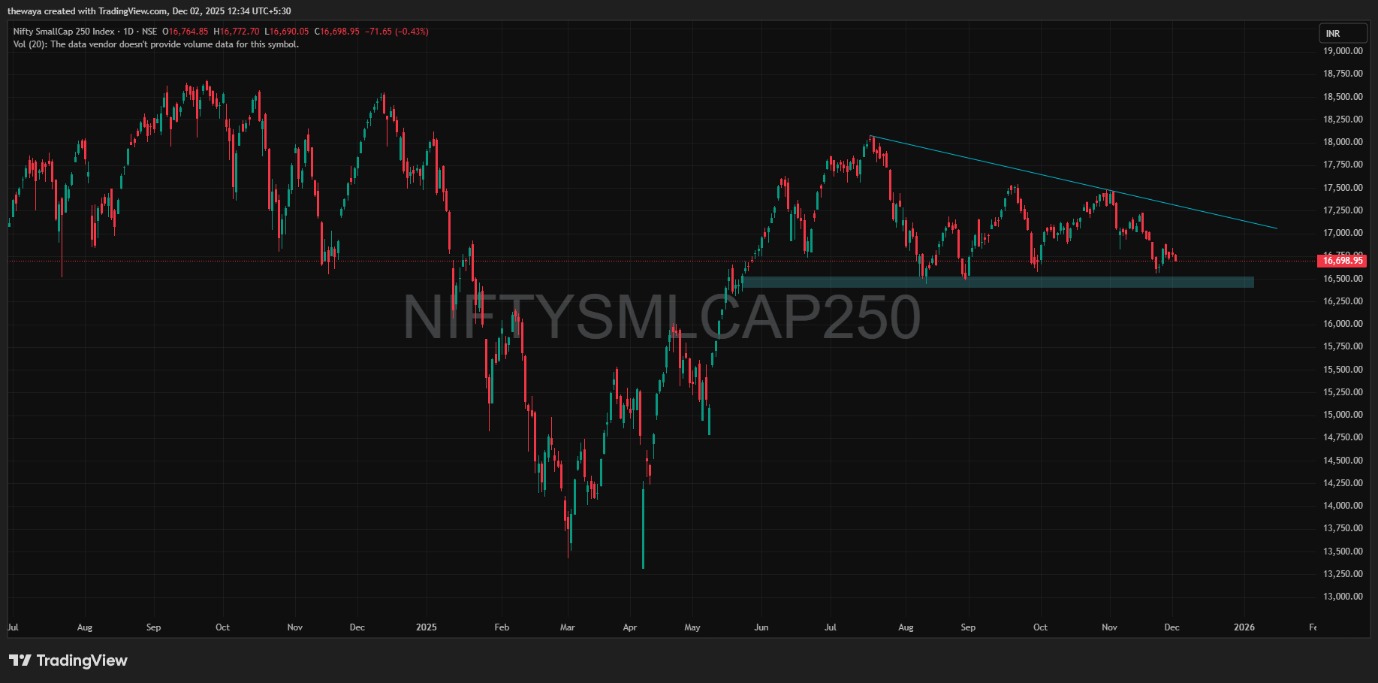
Figure 1: Nifty Smallcap 250 Base Formation (June–Nov 2025)
2. Valuation Reset Complete
After 14+ months of consolidation, small-cap valuations have undergone significant compression:
- Time correction: 12+ months of sideways/declining prices
- Earnings growth: 10-12% during the correction period
- Result: P/E multiples now at attractive levels relative to historical averages
"The consolidation period may extend for a couple of additional months... We anticipate the downside risk to be limited to a range of 3 to 5 percent".
3. Earnings Recovery Underway
Corporate earnings, which had slowed to high single-digit growth in FY25 and H1 FY26, are now showing signs of recovery in Q3 FY26. Key improvements:
- GST rate cuts on mass consumption products boosting demand
- Direct tax cuts for lower/middle-income households taking effect
4. Retail Support Remains Strong
SIP (Systematic Investment Plan) flows have provided steady support, preventing deeper corrections. However, mutual funds are running lower cash balances, indicating most available domestic capital is already deployed — setting the stage for upside when FII flows reverse.
Capital Flow Rotation: The Path to Small Cap Recovery
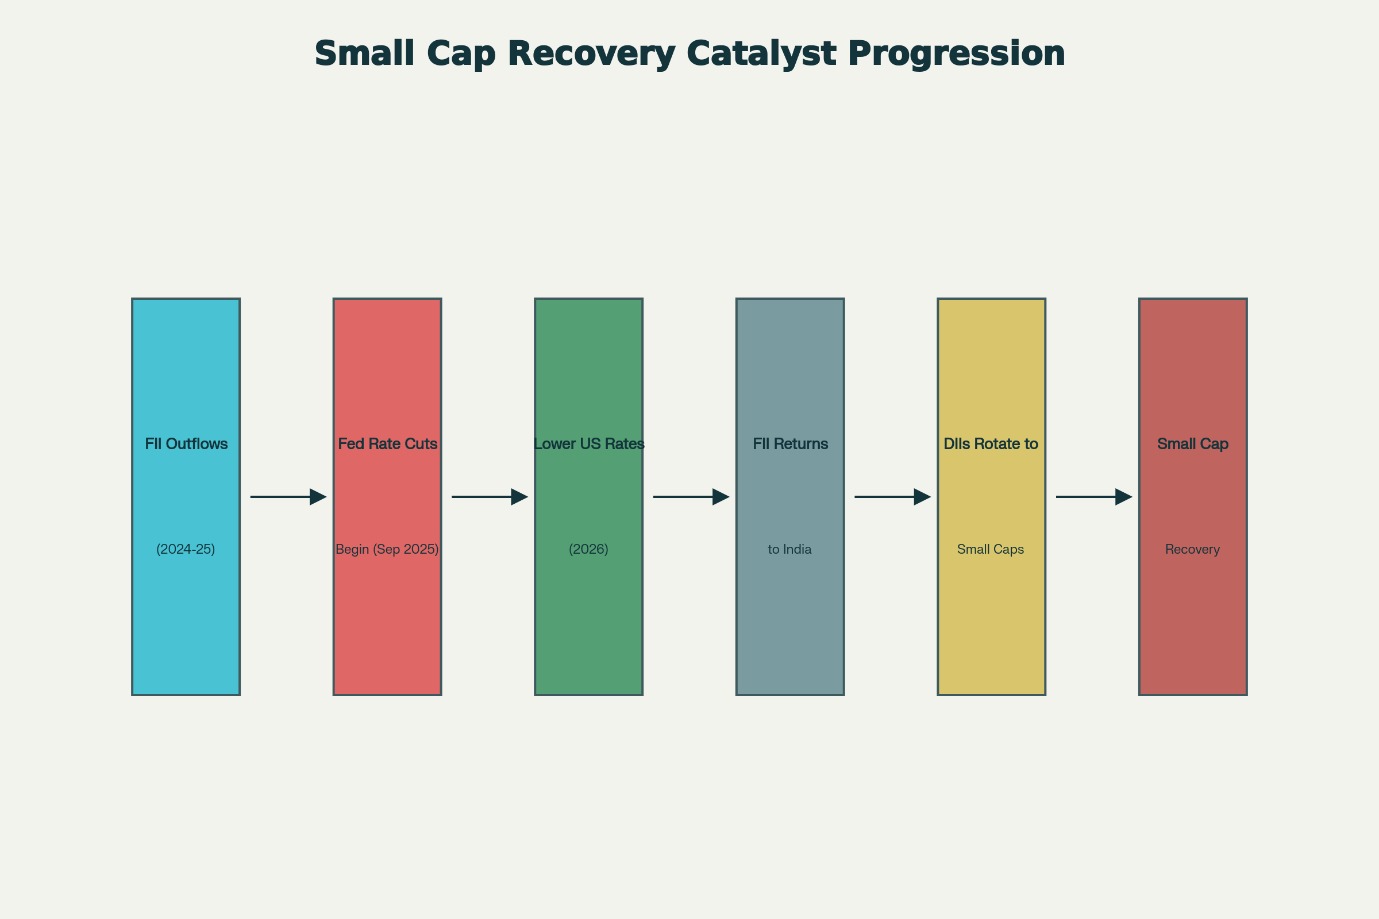
Figure 2: Capital Flow Rotation: The Path to Small Cap Recovery
The Catalyst: Fed Rate Cuts & Capital Flow Reversal
The Turning Point Has Arrived
The US Federal Reserve initiated its easing cycle in September
2025 with a 25 basis point cut, bringing rates to 4.0-4.25%. The
Fed has signaled two more cuts in 2025 and one in 2026.
Why This Matters for Small Caps:
- Phase 1 (Current): Fed cuts → Lower US Treasury yields → Improved relative attractiveness of emerging markets
- Phase 2 (Near-term): FII flows return to India → Initial buying concentrated in liquid large caps (typical pattern)
- Phase 3 (The Opportunity): As FIIs absorb large-cap supply from DIIs, domestic institutions rotate capital into small and mid-caps where valuations are more attractive
When combined with domestic factors, including the RBI's interest rate reductions (50 bps cut in June 2025 and another in April), the outlook for India's economy appears strong. The RBI has cut rates by 100 bps cumulatively, improving liquidity conditions.
Historical Precedent
This capital rotation pattern has played out repeatedly in Indian market cycles. FII-led large-cap rallies typically create liquidity conditions that eventually cascade into broader market outperformance as domestic institutions redeploy capital.
India: The Compelling Long-Term Story
Blackstone's Vote of Confidence
Global private equity giant Blackstone has made India its #1 investment destination globally, CEO Stephen Schwarzman video at 27:36 min:
Blackstone Investor Meet Link: https://www.youtube.com/watch?v=lUXy6Xp2j_I&t=1s
Structural Valuation Advantage
The recent correction has created an attractive entry point:
Valuation Compression:
- MSCI India Index: Now trading at 24x forward P/E — in line with US at 24.2x
- India's narrowest valuation gap with US since 2016
- Post-correction, small-caps now trade at reasonable multiples relative to earnings growth potential
Long-Term Performance:
- India leads global peers on 5-year market returns
- Post-COVID ROE strength remains intact
- MSCI India outperformance demonstrates structural advantages
Waya PMS: Positioned for the Next Upcycle
Our Performance in Context
Waya PMS's BIN73 Sunrise Alpha strategy has navigated this challenging environment while maintaining its focus on high-conviction small-cap opportunities:
Track Record (6-month ending October):
- Consistent Outperformance: Ranked in top 3 in small & mid cap category over 6-month period
- Benchmark-Beating: Consistently delivered positive returns while outperforming benchmarks even during market volatility
Our investment philosophy remains unchanged with High-Conviction, Quality-Focused Approach.
The Investment Thesis: Why Small Caps Will Outperform
Multiple Tailwinds Converging
Macro Catalysts:
- Fed easing cycle reducing opportunity cost of emerging market investment
- RBI rate cuts (100 bps cumulative) improving domestic liquidity
- Fiscal stimulus from Union Budget 2025 and GST 2.0 reforms
- Earnings recovery gaining momentum in Q3/Q4 FY26
Market Structure Factors:
- Valuation advantage: Select small caps now trade at attractive multiples vs. large caps
- Capital rotation setup: FII return to large caps will trigger DII shift to small caps
- Supply overhang clearing: IPO wave of 2025 subsiding into 2026
- Historical patterns: Small-cap cycles typically last 3-4 years; 2022-24 rally followed by 12-month consolidation suggests next leg beginning
Company-Level Opportunities:
- Undiscovered quality: Many fundamentally strong businesses still under-researched and under-owned
- Graduation potential: Small caps approaching mid-cap thresholds (₹30,700 crore cutoff) attract new institutional buyers
- Operational leverage: Smaller companies show higher earnings growth elasticity in recovery cycles
- M&A potential: Consolidation trends create value realization opportunities
Why Patience Will Be Rewarded
Historical Context: From FY20 to FY24, small caps delivered ~44% CAGR, vastly outperforming global benchmarks. The current consolidation is healthy and normal — eliminating speculative excess while setting up the next growth phase.
Technical Setup: The index is forming a base pattern — a classic accumulation structure that precedes significant rallies. Structurally, the slower pace of retracement signifies inherent strength.
Fundamental Support: Corporate earnings of BSE 500 companies are expected to accelerate from high single-digit growth in FY25 to ~15% in FY26, with small caps typically showing higher operating leverage to macro recovery.
The Case for Conviction
The past 12 months have tested conviction, but the fundamental thesis remains intact.
The underperformance of small caps was driven by temporary cyclical factors — FII outflows chasing US rates and AI stocks, record IPO supply, and DII preference for large-cap liquidity. None of these factors reflect deterioration in India's structural growth story or the quality of businesses in our portfolio.
Multiple indicators now suggest we are in the final innings of consolidation:
- Technical patterns showing base formation and higher lows
- Valuations compressed to attractive levels after 12+ months
- Earnings recovery visible in recent quarters
- Fed rate cuts initiated; capital flow reversal beginning
- Historical December seasonality in our favor
Most importantly, India remains the most compelling investment destination among major economies — validated by Blackstone's 40% annual returns and commitment to deploy $100 billion.
The time to be fearful was 12 months ago when valuations were stretched. The time to be greedy is now — when quality businesses are available at compelling prices and multiple catalysts are aligning.
We appreciate your trust and patience during this consolidation phase. The best returns come to those who stay invested through cycles, not those who chase performance. As always, our team remains committed to rigorous research, disciplined execution, and transparent communication. We welcome your questions and feedback.
Here's to the next phase of wealth creation.
Regards
Amit Vora, CEO